Rendimiento de servidor Web con Varnish
- Tarea 1: Vamos a configurar una máquina con la configuración ganadora: nginx + fpm_php (socket unix.Para ello ejecuta la receta ansible que encontraras en este repositorio. Accede al wordpress y termina la configuración del sitio.
Una vez que tengamos el repositorio en nuestra maquina, debemos de modificar la ip que tenemos en nuestro fichero host y poner la ip del equipo al que nos vayamos a conectar, es este caso la de mi equipo es 172.22.201.6.
Acceso a wordpress:
-
Tarea 2: Vamos a hacer las pruebas de rendimiento desde la misma máquina, es decir vamos a ejecutar instrucciones similares a esta:
ab -t 10 -c 200 -k http:/127.0.0.1/wordpress/index.php
Realiza algunas prueba de rendimiento con varios valores distintos para el nivel de concurrencia (50,100,250,500) y apunta el resultado de peticiones/segundo (parámetro Requests per second de ab). Puedes hacer varias pruebas y quedarte con la media. Reinicia el servidor nginx y el fpm-php entre cada prueba para que los resultados sean los más reales posibles.*
Para ser capaces de ejecutar el comando ab, tendremos que instalar previamente el paquete apache2-utils por lo que lo instalaremos en nuestra maquina:
ansible all -m apt -a “pkg=apache2-utils” -b o bien apt install apache2 utils dentro de la maquina
Una vez instalado, nos ponemos ha hacer las pruebas:
(ansible) sergioib@debian-sergio:~/Escritorio/Informatica/Virtualenv/ansible/ansible_nginx_fpm_php$ ansible servidores_web -m shell -a "ab -t 10 -c 50 -k http://localhost/wordpress/index.php"
nodo1 | CHANGED | rc=0 >>
This is ApacheBench, Version 2.3 <$Revision: 1843412 $>
Copyright 1996 Adam Twiss, Zeus Technology Ltd, http://www.zeustech.net/
Licensed to The Apache Software Foundation, http://www.apache.org/

Benchmarking localhost (be patient)


Server Software:        nginx/1.14.2
Server Hostname:        localhost
Server Port:            80

Document Path:          /wordpress/index.php
Document Length:        0 bytes

Concurrency Level:      50
Time taken for tests:   10.029 seconds
Complete requests:      301
Failed requests:        0
Non-2xx responses:      301
Keep-Alive requests:    0
Total transferred:      65317 bytes
HTML transferred:       0 bytes
Requests per second:    30.01 [#/sec] (mean)
Time per request:       1665.866 [ms] (mean)
Time per request:       33.317 [ms] (mean, across all concurrent requests)
Transfer rate:          6.36 [Kbytes/sec] received

Connection Times (ms)
              min  mean[+/-sd] median   max
Connect:        0    0   0.7      0       3
Processing:    56 1466 338.4   1574    1696
Waiting:       56 1466 338.5   1574    1696
Total:         59 1467 337.8   1575    1696

Percentage of the requests served within a certain time (ms)
  50%   1574
  66%   1592
  75%   1613
  80%   1631
  90%   1651
  95%   1669
  98%   1679
  99%   1682
 100%   1696 (longest request)Finished 301 requests
(ansible) sergioib@debian-sergio:~/Escritorio/Informatica/Virtualenv/ansible/ansible_nginx_fpm_php$ ansible servidores_web -m shell -a "ab -t 10 -c 100 -k http://localhost/wordpress/index.php"
nodo1 | CHANGED | rc=0 >>
This is ApacheBench, Version 2.3 <$Revision: 1843412 $>
Copyright 1996 Adam Twiss, Zeus Technology Ltd, http://www.zeustech.net/
Licensed to The Apache Software Foundation, http://www.apache.org/

Benchmarking localhost (be patient)


Server Software:        nginx/1.14.2
Server Hostname:        localhost
Server Port:            80

Document Path:          /wordpress/index.php
Document Length:        0 bytes

Concurrency Level:      100
Time taken for tests:   10.113 seconds
Complete requests:      321
Failed requests:        0
Non-2xx responses:      321
Keep-Alive requests:    0
Total transferred:      69657 bytes
HTML transferred:       0 bytes
Requests per second:    31.74 [#/sec] (mean)
Time per request:       3150.483 [ms] (mean)
Time per request:       31.505 [ms] (mean, across all concurrent requests)
Transfer rate:          6.73 [Kbytes/sec] received

Connection Times (ms)
              min  mean[+/-sd] median   max
Connect:        0    3   5.0      0      12
Processing:    33 2649 856.4   3072    3230
Waiting:       27 2649 856.5   3072    3230
Total:         33 2652 854.2   3074    3230

Percentage of the requests served within a certain time (ms)
  50%   3074
  66%   3102
  75%   3131
  80%   3140
  90%   3158
  95%   3185
  98%   3210
  99%   3215
 100%   3230 (longest request)Finished 321 requests
(ansible) sergioib@debian-sergio:~/Escritorio/Informatica/Virtualenv/ansible/ansible_nginx_fpm_php$ ansible servidores_web -m shell -a "ab -t 10 -c 250 -k http://localhost/wordpress/index.php"
nodo1 | CHANGED | rc=0 >>
This is ApacheBench, Version 2.3 <$Revision: 1843412 $>
Copyright 1996 Adam Twiss, Zeus Technology Ltd, http://www.zeustech.net/
Licensed to The Apache Software Foundation, http://www.apache.org/

Benchmarking localhost (be patient)


Server Software:        nginx/1.14.2
Server Hostname:        localhost
Server Port:            80

Document Path:          /wordpress/index.php
Document Length:        0 bytes

Concurrency Level:      250
Time taken for tests:   10.003 seconds
Complete requests:      26135
Failed requests:        25897
   (Connect: 0, Receive: 0, Length: 25897, Exceptions: 0)
Non-2xx responses:      26135
Keep-Alive requests:    25750
Total transferred:      8596921 bytes
HTML transferred:       4480181 bytes
Requests per second:    2612.77 [#/sec] (mean)
Time per request:       95.684 [ms] (mean)
Time per request:       0.383 [ms] (mean, across all concurrent requests)
Transfer rate:          839.31 [Kbytes/sec] received

Connection Times (ms)
              min  mean[+/-sd] median   max
Connect:        0    0   2.8      0      36
Processing:     8   79 436.4     29    6066
Waiting:        8   79 436.3     29    6066
Total:          8   80 437.3     29    6066

Percentage of the requests served within a certain time (ms)
  50%     29
  66%     34
  75%     39
  80%     41
  90%     47
  95%     51
  98%    107
  99%   1440
 100%   6066 (longest request)Completed 5000 requests
Completed 10000 requests
Completed 15000 requests
Completed 20000 requests
Completed 25000 requests
Finished 26135 requests
(ansible) sergioib@debian-sergio:~/Escritorio/Informatica/Virtualenv/ansible/ansible_nginx_fpm_php$ ansible servidores_web -m shell -a "ab -t 10 -c 500 -k http://localhost/wordpress/index.php"
nodo1 | CHANGED | rc=0 >>
This is ApacheBench, Version 2.3 <$Revision: 1843412 $>
Copyright 1996 Adam Twiss, Zeus Technology Ltd, http://www.zeustech.net/
Licensed to The Apache Software Foundation, http://www.apache.org/

Benchmarking localhost (be patient)


Server Software:        nginx/1.14.2
Server Hostname:        localhost
Server Port:            80

Document Path:          /wordpress/index.php
Document Length:        0 bytes

Concurrency Level:      500
Time taken for tests:   10.000 seconds
Complete requests:      33677
Failed requests:        33466
   (Connect: 0, Receive: 0, Length: 33466, Exceptions: 0)
Non-2xx responses:      33677
Keep-Alive requests:    33256
Total transferred:      11088517 bytes
HTML transferred:       5789618 bytes
Requests per second:    3367.61 [#/sec] (mean)
Time per request:       148.473 [ms] (mean)
Time per request:       0.297 [ms] (mean, across all concurrent requests)
Transfer rate:          1082.83 [Kbytes/sec] received

Connection Times (ms)
              min  mean[+/-sd] median   max
Connect:        0    1   4.9      0      47
Processing:    17  125 412.9     92    6422
Waiting:       17  125 412.9     92    6422
Total:         17  126 414.1     92    6462

Percentage of the requests served within a certain time (ms)
  50%     92
  66%    108
  75%    115
  80%    119
  90%    128
  95%    135
  98%    143
  99%    161
 100%   6462 (longest request)Completed 5000 requests
Completed 10000 requests
Completed 15000 requests
Completed 20000 requests
Completed 25000 requests
Completed 30000 requests
Finished 33677 requests
- Tarea 3: Configura un proxy inverso - caché Varnish escuchando en el puerto 80 y que se comunica con el servidor web por el puerto 8080. Entrega y muestra una comprobación de que varnish está funcionando con la nueva configuración. Realiza pruebas de rendimiento (quédate con el resultado del parámetro Requests per second) y comprueba si hemos aumentado el rendimiento. Si hacemos varias peticiones a la misma URL, ¿cuantas peticiones llegan al servidor web? (comprueba el fichero access.log para averiguarlo).
Para ello lo primero que haremos sera instalar en nuestra maquina varnish:
ansible all -m apt -a “pkg=varnish” -b o bien apt install varnish dentro de la maquina.
Configuramos nuestro servidor nginx para que en lugar de escuchar por el puerto 80, escuche por el 8080 ya que el 80 lo necesitaremos para que lo use varnish.
Modificamos en /etc/nginx/sites-aviables/default:
server {
        listen 8080 default_server;
        listen [::]:8080 default_server;
Configuramos varnish para que en lugar de escuchar peticiones por sus puertos por defecto, escuche por el puerto 80
Modificamos en /etc/varnish/default.vcl:
backend default {
    .host = "127.0.0.1";
    .port = "8080";
}
Una vez configurado este fichero, configuraremos /etc/default/varnish de forma que varnish empiece a usar el puerto 80:
DAEMON_OPTS="-a :80 \
			-T localhost:6082 \
			-f /etc/varnish/default.vcl \
			-S /etc/varnish/secret \
			-s malloc,256m"
Por ultimo Modificamos el demonio de systemd en el fichero /lib/systemd/system/varnish.service modificando la linea Execstart y dejandola de la siguiente forma:
ExecStart=/usr/sbin/varnishd -j unix,user=vcache -F -a :80 -T localhost:6082 -f /etc/varnish/default.vcl -S /etc/varnish/secret -s malloc,256m
Reiniciamos los servicios y el demonio:
systemctl daemon-reload
systemctl restart varnish
Comprobamos que wordpress siga funcionando:

Hacemos las mismas pruebas que antes y comprobamos si ha mejorado el rendimiento:
(ansible) sergioib@debian-sergio:~/Escritorio/Informatica/Virtualenv/ansible/ansible_nginx_fpm_php$ ansible servidores_web -m shell -a "ab -t 10 -c 50 -k http://localhost/wordpress/index.php"
nodo1 | CHANGED | rc=0 >>
This is ApacheBench, Version 2.3 <$Revision: 1843412 $>
Copyright 1996 Adam Twiss, Zeus Technology Ltd, http://www.zeustech.net/
Licensed to The Apache Software Foundation, http://www.apache.org/

Benchmarking localhost (be patient)


Server Software:        nginx/1.14.2
Server Hostname:        localhost
Server Port:            80

Document Path:          /wordpress/index.php
Document Length:        0 bytes

Concurrency Level:      50
Time taken for tests:   4.027 seconds
Complete requests:      50000
Failed requests:        0
Non-2xx responses:      50000
Keep-Alive requests:    50000
Total transferred:      15315901 bytes
HTML transferred:       0 bytes
Requests per second:    12415.25 [#/sec] (mean)
Time per request:       4.027 [ms] (mean)
Time per request:       0.081 [ms] (mean, across all concurrent requests)
Transfer rate:          3713.88 [Kbytes/sec] received

Connection Times (ms)
              min  mean[+/-sd] median   max
Connect:        0    0   0.2      0       9
Processing:     0    4   0.8      3      38
Waiting:        0    4   0.8      3      30
Total:          0    4   0.9      3      38
WARNING: The median and mean for the processing time are not within a normal deviation
        These results are probably not that reliable.
WARNING: The median and mean for the waiting time are not within a normal deviation
        These results are probably not that reliable.
WARNING: The median and mean for the total time are not within a normal deviation
        These results are probably not that reliable.

Percentage of the requests served within a certain time (ms)
  50%      3
  66%      5
  75%      5
  80%      5
  90%      5
  95%      5
  98%      6
  99%      6
 100%     38 (longest request)Completed 5000 requests
Completed 10000 requests
Completed 15000 requests
Completed 20000 requests
Completed 25000 requests
Completed 30000 requests
Completed 35000 requests
Completed 40000 requests
Completed 45000 requests
Completed 50000 requests
Finished 50000 requests
(ansible) sergioib@debian-sergio:~/Escritorio/Informatica/Virtualenv/ansible/ansible_nginx_fpm_php$ ansible servidores_web -m shell -a "ab -t 10 -c 100 -k http://localhost/wordpress/index.php"
nodo1 | CHANGED | rc=0 >>
This is ApacheBench, Version 2.3 <$Revision: 1843412 $>
Copyright 1996 Adam Twiss, Zeus Technology Ltd, http://www.zeustech.net/
Licensed to The Apache Software Foundation, http://www.apache.org/

Benchmarking localhost (be patient)


Server Software:        nginx/1.14.2
Server Hostname:        localhost
Server Port:            80

Document Path:          /wordpress/index.php
Document Length:        0 bytes

Concurrency Level:      100
Time taken for tests:   4.048 seconds
Complete requests:      50000
Failed requests:        0
Non-2xx responses:      50000
Keep-Alive requests:    50000
Total transferred:      15381977 bytes
HTML transferred:       0 bytes
Requests per second:    12352.67 [#/sec] (mean)
Time per request:       8.095 [ms] (mean)
Time per request:       0.081 [ms] (mean, across all concurrent requests)
Transfer rate:          3711.10 [Kbytes/sec] received

Connection Times (ms)
              min  mean[+/-sd] median   max
Connect:        0    0   0.4      0      10
Processing:     0    8   1.0      8      15
Waiting:        0    8   1.0      8      15
Total:          0    8   1.1      8      20

Percentage of the requests served within a certain time (ms)
  50%      8
  66%      8
  75%      8
  80%      9
  90%      9
  95%      9
  98%     11
  99%     12
 100%     20 (longest request)Completed 5000 requests
Completed 10000 requests
Completed 15000 requests
Completed 20000 requests
Completed 25000 requests
Completed 30000 requests
Completed 35000 requests
Completed 40000 requests
Completed 45000 requests
Completed 50000 requests
Finished 50000 requests
(ansible) sergioib@debian-sergio:~/Escritorio/Informatica/Virtualenv/ansible/ansible_nginx_fpm_php$ ansible servidores_web -m shell -a "ab -t 10 -c 250 -k http://localhost/wordpress/index.php"
nodo1 | CHANGED | rc=0 >>
This is ApacheBench, Version 2.3 <$Revision: 1843412 $>
Copyright 1996 Adam Twiss, Zeus Technology Ltd, http://www.zeustech.net/
Licensed to The Apache Software Foundation, http://www.apache.org/

Benchmarking localhost (be patient)


Server Software:        nginx/1.14.2
Server Hostname:        localhost
Server Port:            80

Document Path:          /wordpress/index.php
Document Length:        0 bytes

Concurrency Level:      250
Time taken for tests:   4.452 seconds
Complete requests:      50000
Failed requests:        0
Non-2xx responses:      50000
Keep-Alive requests:    50000
Total transferred:      15392783 bytes
HTML transferred:       0 bytes
Requests per second:    11231.58 [#/sec] (mean)
Time per request:       22.259 [ms] (mean)
Time per request:       0.089 [ms] (mean, across all concurrent requests)
Transfer rate:          3376.66 [Kbytes/sec] received

Connection Times (ms)
              min  mean[+/-sd] median   max
Connect:        0    0   1.9      0      36
Processing:     1   22   1.7     22      48
Waiting:        0   22   1.7     22      48
Total:          1   22   3.3     22      83

Percentage of the requests served within a certain time (ms)
  50%     22
  66%     22
  75%     22
  80%     22
  90%     23
  95%     23
  98%     26
  99%     27
 100%     83 (longest request)Completed 5000 requests
Completed 10000 requests
Completed 15000 requests
Completed 20000 requests
Completed 25000 requests
Completed 30000 requests
Completed 35000 requests
Completed 40000 requests
Completed 45000 requests
Completed 50000 requests
Finished 50000 requests
(ansible) sergioib@debian-sergio:~/Escritorio/Informatica/Virtualenv/ansible/ansible_nginx_fpm_php$ ansible servidores_web -m shell -a "ab -t 10 -c 500 -k http://localhost/wordpress/index.php"
nodo1 | CHANGED | rc=0 >>
This is ApacheBench, Version 2.3 <$Revision: 1843412 $>
Copyright 1996 Adam Twiss, Zeus Technology Ltd, http://www.zeustech.net/
Licensed to The Apache Software Foundation, http://www.apache.org/

Benchmarking localhost (be patient)


Server Software:        nginx/1.14.2
Server Hostname:        localhost
Server Port:            80

Document Path:          /wordpress/index.php
Document Length:        0 bytes

Concurrency Level:      500
Time taken for tests:   7.909 seconds
Complete requests:      50000
Failed requests:        0
Non-2xx responses:      50000
Keep-Alive requests:    50000
Total transferred:      15463748 bytes
HTML transferred:       0 bytes
Requests per second:    6321.89 [#/sec] (mean)
Time per request:       79.090 [ms] (mean)
Time per request:       0.158 [ms] (mean, across all concurrent requests)
Transfer rate:          1909.38 [Kbytes/sec] received

Connection Times (ms)
              min  mean[+/-sd] median   max
Connect:        0    3  47.0      0    1134
Processing:     0   76  19.8     79     558
Waiting:        0   76  19.8     79     558
Total:          0   79  51.3     79    1216

Percentage of the requests served within a certain time (ms)
  50%     79
  66%     80
  75%     80
  80%     81
  90%     82
  95%     84
  98%    127
  99%    172
 100%   1216 (longest request)Completed 5000 requests
Completed 10000 requests
Completed 15000 requests
Completed 20000 requests
Completed 25000 requests
Completed 30000 requests
Completed 35000 requests
Completed 40000 requests
Completed 45000 requests
Completed 50000 requests
Finished 50000 requests
La diferencia entre usar o no varnish es bastante considerable:
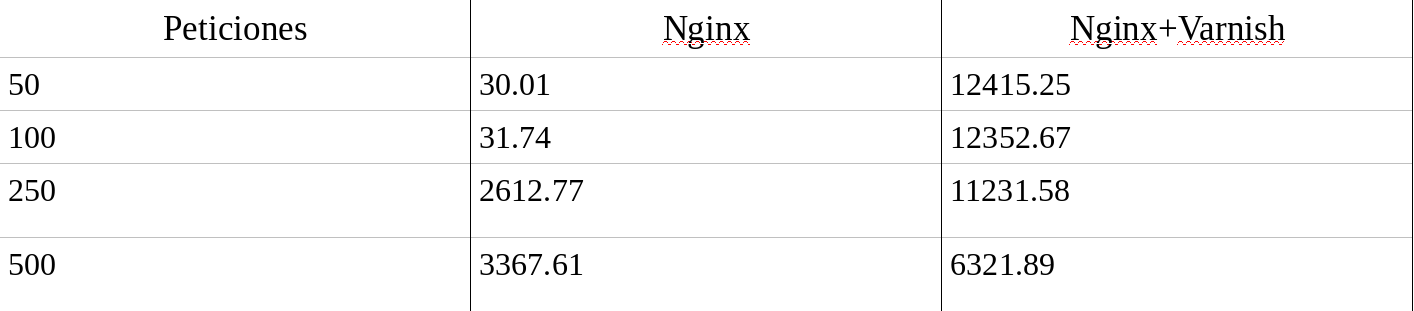
Como vemos la diferencia es bastante considerable, ya que al tener el proxy inverso de varnish, en lugar de mandar la petición al servidor y acceder al index.php constantemente una y otra vez, con varnish se accede una sola, el resto de veces que se hace la peticion directamente se coge el index.php de la cache, por lo que agiliza mucho al servido y por lo tanto permite que responda mas peticiones por segundo.